


rwevalidate is an R package that validates patient
cohorts for real-world evidence (RWE) studies on OMOP Common Data
Model data. A single function call runs four validation modules,
then produces a self-contained HTML report and a machine-readable JSON
sidecar aligned with FDA guidance and the HARPER protocol.
The package was built because no existing OHDSI tool combines cohort-level attrition auditing, temporal data density, concept coverage, and covariate balance into one regulator-ready output. It does not depend on CohortDiagnostics, DataQualityDashboard, or Achilles, so it installs and runs in any R environment that has a DBI connection to an OMOP CDM.
Current status: v0.1 is complete and live-tested against MIMIC-IV on PostgreSQL. All four modules are available. The package website is at tavakohr.github.io/rwevalidate.
A single validate_cohort() call produces this
self-contained HTML report. Each check maps to a regulatory framework
and resolves to a pass / warn / fail.
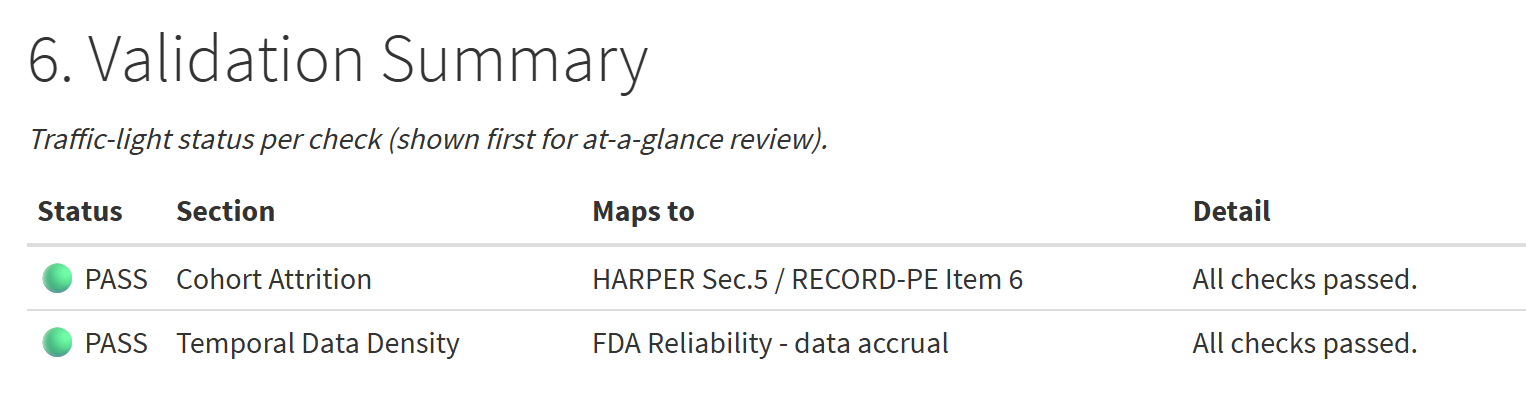
Traffic-light validation summary from the built-in synthetic cohort.
When you submit an RWE study to a regulator, they always ask two questions. First, is the data relevant to the research question? In other words, are the right patients captured, with the right concepts? Second, is the data reliable enough to support causal inference? In other words, is follow-up complete, are records frequent enough over time, and are the two cohorts comparable?
Today, answering both questions in a clear and reproducible way means
combining several tools or writing custom SQL by hand.
rwevalidate does that work for you. You give it a cohort
table that already exists in the database, and it returns one list
object and a formatted report. Every check in the report maps directly
to a regulatory framework.
Every check in rwevalidate traces back to a published
regulatory document or reporting standard. The table below shows which
module maps to which framework and why.
| Module | Function | Framework | Document | What Section Covers |
|---|---|---|---|---|
| 1 | run_concepts() |
FDA RWE Guidance: Relevance | FDA (2023) Real-World Data and Real-World Evidence | Are the cohort-defining concepts present, well-mapped, and ancestry-expanded in the vocabulary? This is the “fit-for-purpose data” question. |
| 2 | run_attrition() |
HARPER Protocol (S5) + RECORD-PE (Item 6) | Wang et al. 2022; Langan et al. 2018 | Can you justify who was included and excluded? Covers cohort size, index-date distribution, prior observation coverage, and demographics at index. |
| 3 | run_density() |
FDA RWE Guidance: Reliability | FDA (2023) Real-World Data and Real-World Evidence | Is the recorded data complete over time? Covers records per patient per month across four clinical domains and follow-up censoring breakdown. |
| 4 | run_covariates() |
HARPER Protocol (S4) | Wang et al. 2022 | Are the exposure groups comparable? Covers standardized mean differences (love plot), per-arm concept prevalence, and a power calculation. |
FDA RWE Guidance (2023) U.S. Food and Drug Administration. Considerations for the Use of Real-World Data and Real-World Evidence to Support Regulatory Decision-Making for Drug and Biological Products. Guidance for Industry. Silver Spring, MD: FDA; 2023. Available at: www.fda.gov/media/171667/download
The FDA guidance looks at RWE studies from two angles. Relevance asks
whether the data source captures the population, exposure, outcome, and
covariates that the study wants to measure. Reliability asks whether the
data are complete, recorded in a consistent way, and free from
systematic dropout or bias in how outcomes are captured. Modules 1 and 3
in rwevalidate answer these two questions directly.
HARPER Protocol (2022) Wang SV, Pottegard A, Crown W, et al. HARmonized Protocol Template to Enhance Reproducibility of hypothesis evaluating real-world evidence studies on treatment effects: A good practices report of a joint ISPE/ISPOR task force. Pharmacoepidemiol Drug Saf. 2023;32(1):44-55. Available at: doi.org/10.1002/pds.5507
HARPER is a structured protocol template designed to make pharmacoepidemiology RWE studies reproducible and independently verifiable before data analysis begins. Section 4 specifies how covariates should be defined and balanced across arms. Section 5 specifies how cohort definition criteria and their sequential attrition should be documented. Modules 2 and 4 produce output that can populate these two sections directly.
RECORD-PE (2015, extended 2018) Benchimol EI, Smeeth L, Guttmann A, et al. The REporting of studies Conducted using Observational Routinely-collected health Data (RECORD) Statement. PLoS Med. 2015;12(10):e1001885. Langan SM, Schmidt SA, Wing K, et al. The reporting of studies conducted using observational routinely collected health data statement for pharmacoepidemiology (RECORD-PE). BMJ. 2018;363:k3532. Available at: doi.org/10.1136/bmj.k3532
Item 6 of the RECORD-PE checklist requires a patient flowchart
showing how many individuals were identified at each stage of cohort
construction and why they were excluded. run_attrition()
reports the cohort-level counts this item asks for (size, index dates,
prior observation, demographics). It does not yet rebuild the
step-by-step flowchart itself, because the instantiated cohort table
does not carry the criteria that produced it. Per-criterion attrition is
planned for a later version.
validate_cohort() is the main entry point. It connects
to the CDM, runs each module in sequence, collects their flags, and
calls render_validation_report() to produce the final
outputs. All connection management is handled internally: if you pass an
open con it is left open when the function exits; if you
pass PostgreSQL credentials a connection is opened and closed
automatically.
The four modules are independent of each other. Each one queries the
CDM directly using DBI::dbGetQuery() with parameterized
glue templates, returns a named list, and appends any
threshold violations as WARN: or FAIL: strings
to a flags vector. The orchestrator in
validate_cohort() collects all flags and feeds them to the
traffic-light summary in the report.
validate_cohort()
    |
    +-- cdm_connect()              # opens DBI connection, validates tables exist
    |
    +-- run_concepts()  [opt]      # Module 1: concept coverage (needs concept_ids)
    +-- run_attrition()            # Module 2: attrition audit (always runs)
    +-- run_density()              # Module 3: temporal data density (always runs)
    +-- run_covariates() [opt]     # Module 4: covariate balance (needs comparator_id)
    |
    +-- render_validation_report() # builds HTML + JSON from module outputs
    |
+-- cdm_disconnect() # closes connection if opened internallyrwevalidate handles CDM environments where clinical and
vocabulary tables live in separate schemas. The cdm_schema
argument points to tables like condition_occurrence,
person, and observation_period. The
vocab_schema argument points to concept and
concept_ancestor. This matters because some CDM deployments
(including the MIMIC-IV OMOP build) populate the vocabulary schema
separately, leaving the clinical schema’s concept table empty. All
vocabulary lookups in the package route through
vocab_schema.
All thresholds are function arguments with documented defaults. Nothing is hardcoded.
| Check | Warn | Fail |
|---|---|---|
| Prior observation coverage | Below 70% of cohort | Below 50% |
| Single attrition step drop | Over 50% of prior N | Over 80% |
| Concept prevalence (Module 1) | Below 10% | Below 1% |
Every run writes two files to output_dir:
validation_report.html: a self-contained HTML file with
embedded plots, tables, and a traffic-light summary. No server needed to
open it.validation_results.json: a machine-readable sidecar
with all numeric results, flags, run metadata, and package version.
Useful for downstream pipelines or audit logs.The HTML report is rendered from an R Markdown template using
rmarkdown::render(). If Pandoc is not available,
validate_cohort() falls back to writing the JSON sidecar
only and emits a warning rather than an error.
# Install from GitHub
remotes::install_github("tavakohr/rwevalidate")

# Or from a local clone
install.packages(".", repos = NULL, type = "source")
Requires R >= 4.1. HTML rendering requires Pandoc, which is
bundled with RStudio. If you are running from the command line without
RStudio, set the environment variable RSTUDIO_PANDOC to the
folder containing the Pandoc binary.
# Example for command-line / Rscript users
Sys.setenv(RSTUDIO_PANDOC = "/usr/lib/rstudio/resources/app/bin/quarto/bin/tools")You do not need a live database to see the package work.
example_cdm() builds a tiny synthetic OMOP CDM in an
in-memory DuckDB database and returns a live connection you can pass
straight to validate_cohort(). This needs the
duckdb package installed
(install.packages("duckdb")).
library(rwevalidate)

con <- example_cdm()   # tiny synthetic OMOP CDM in in-memory DuckDB

out <- validate_cohort(
  cdm_schema   = "main",       # the demo CDM uses the default DuckDB schema
  cohort_table = "cohort",
  cohort_id    = 1,
  con          = con,
  vocab_schema = "main",
  output_dir   = tempfile("rwe_demo_"),
  render_html  = FALSE         # write the JSON sidecar only, no Pandoc needed
)

out$report$check_summary       # traffic-light table: attrition + density both pass
cdm_disconnect(con)The fixture is entirely synthetic. It contains no MIMIC-IV or other real patient data, so it is safe to ship and runs offline. It holds 10 fake patients in one heart-failure cohort, with every table the attrition and density modules query:
| Table | Contents |
|---|---|
person |
10 patients, alternating sex, birth years 1948-1975 |
observation_period |
~3 years of coverage each, staggered start dates |
condition_occurrence |
one heart-failure record each (SNOMED 316139) |
drug_exposure, measurement,
visit_occurrence |
one record each near the index date |
death |
2 of the 10 patients die; the rest are censored at cohort exit |
concept, concept_ancestor |
minimal vocabulary (sex labels, heart failure, a few others) |
cohort |
the 10 patients as cohort_definition_id = 1 |
It deliberately omits a comparator arm and a rich vocabulary, so it exercises the default attrition and density checks but not Module 1 (concept coverage) or Module 4 (covariate feasibility). For those, and for any real analysis, point the package at an actual OMOP CDM as shown below.
library(rwevalidate)

out <- validate_cohort(
  cdm_schema     = "mimic_cdm",
  cohort_table   = "results.rwevalidate_test_cohort",
  cohort_id      = 1,
  vocab_schema   = "vocab",
  obs_window     = c(-365, 0),      # 365 days prior observation required
  density_window = c(-365, 365),    # 1 year before and after index
  output_dir     = "./validation_report",
  host           = "localhost",
  port           = 5432,
  dbname         = "FHIR",
  user           = "your_user",
  password       = "your_password"
)

# Review collected flags
out$flags

# Review traffic-light summary table
out$report$check_summaryout <- validate_cohort(
cdm_schema = "mimic_cdm",
cohort_table = "results.rwevalidate_test_cohort",
cohort_id = 1,
comparator_id = 2, # enables Module 4 (covariate balance)
concept_ids = c(316139), # enables Module 1 (concept coverage)
concept_domain = "condition",
vocab_schema = "vocab",
obs_window = c(-365, 0),
density_window = c(-365, 365),
output_dir = "./validation_report",
host = "localhost", port = 5432,
dbname = "FHIR", user = "your_user", password = "your_password"
)con <- cdm_connect(
host = "localhost", port = 5432,
dbname = "FHIR", user = "your_user", password = "your_password",
cdm_schema = "mimic_cdm", vocab_schema = "vocab"
)
out <- validate_cohort(
con = con, # connection is left open when validate_cohort() exits
cdm_schema = "mimic_cdm",
cohort_table = "results.rwevalidate_test_cohort",
cohort_id = 1,
output_dir = "./validation_report"
)
DBI::dbDisconnect(con)Each module can be called on its own if you only need part of the validation.
con <- cdm_connect(...)

# Module 2 only: attrition audit
attrition <- run_attrition(
  con,
  cdm_schema   = "mimic_cdm",
  cohort_table = "results.rwevalidate_test_cohort",
  cohort_id    = 1,
  obs_window   = c(-365, 0)
)

attrition$cohort_size       # integer: distinct subjects
attrition$obs_coverage      # data.frame: coverage statistics
attrition$demographics      # data.frame: age and sex at index
attrition$flags # character vector: any WARN:/FAIL: messagesrun_concepts)Maps to FDA RWE Guidance: Relevance.
Checks whether the concepts used to define the cohort are actually
present in the CDM, how well they are mapped to standard vocabulary, and
what proportion of the cohort has a recorded event under each concept
and its descendants. It expands seed concept IDs through the
concept_ancestor table and computes prevalence and mapping
rates per domain.
run_concepts(
  con, cdm_schema, cohort_table, cohort_id,
  concept_ids    = c(316139),    # seed SNOMED concept ID for heart failure
  domain         = "condition",
  vocab_schema   = "vocab",
  prev_warn_pct  = 10,           # warn if prevalence below 10%
  prev_fail_pct  = 1             # fail if prevalence below 1%
)run_attrition)Maps to HARPER Protocol Section 5 and RECORD-PE Item 6.
Profiles the cohort population with four queries: (2a) total distinct subjects, (2b) index date distribution by year, (2c) prior observation coverage relative to the required lookback window, and (2d) age and sex at index date. Flags are raised when prior observation coverage falls below the warn or fail threshold.
run_attrition(
  con, cdm_schema, cohort_table, cohort_id,
  obs_window    = c(-365, 0),
  vocab_schema  = "vocab",
  obs_warn_pct  = 70,
  obs_fail_pct  = 50
)run_density)Maps to FDA RWE Guidance: Reliability.
Computes records per patient per month relative to index date across four clinical domains: conditions, drugs, measurements, and visits. Also produces a follow-up completeness table showing how each subject’s observation period ends (death, cohort exit, or end of available data). Sparse density in specific months can indicate data gaps or coding practice changes.
run_density(
  con, cdm_schema, cohort_table, cohort_id,
  obs_window = c(-365, 365)
)run_covariates)Maps to HARPER Protocol Section 4.
Requires a comparator cohort. Computes standardized mean differences (SMDs) for binary and continuous covariates across the target and comparator arms, ranks the top concepts by prevalence, and estimates study power. SMD values above 0.1 are conventionally considered imbalanced and are flagged.
run_covariates(
  con, cdm_schema, cohort_table, cohort_id,
  comparator_id = 2,
  vocab_schema  = "vocab",
  obs_window    = c(-365, 0)
)The HTML report has six sections. Each section corresponds to one regulatory framework requirement.
| Section | Content | Framework |
|---|---|---|
| 1. Data Source Summary | CDM version, patient count, date range | FDA Relevance |
| 2. Concept Coverage | Prevalence by concept, mapping rate, ancestor expansion | FDA Relevance |
| 3. Cohort Attrition | Size table, index-date histogram, observation coverage, demographics | HARPER S5 + RECORD-PE Item 6 |
| 4. Temporal Data Density | Records per patient per month heatmap, follow-up plot | FDA Reliability |
| 5. Covariate Feasibility | SMD love plot, prevalence table, power | HARPER S4 |
| 6. Validation Summary | Traffic-light table: pass (green), warn (amber), fail (red) | All frameworks |
Section 2 is populated only when concept_ids is
supplied. Section 5 is populated only when comparator_id is
supplied. Both show placeholder text otherwise so the report structure
stays consistent across runs.
validate_cohort() warns if the
connected CDM reports a version outside 5.3.x.testthat mock.DBI. They are not yet
translated with SqlRender, so other OHDSI backends (SQL
Server, Redshift, Oracle, BigQuery) are not supported in this version.
Multi-dialect support via SqlRender is on the roadmap for
OHDSI network use.subject_id,
cohort_definition_id, cohort_start_date, and
cohort_end_date columns. ATLAS JSON parsing is not
supported.Bug reports, feature ideas, and pull requests are welcome. Development and testing run offline against a synthetic DuckDB CDM, so you do not need a live database. See CONTRIBUTING.md for setup, testing, and the pull-request process.
MIT. See LICENSE.